Updated Paper Club
economics of RSI
Click here to open and read The Economics of Recursive Self-Improvement ↗
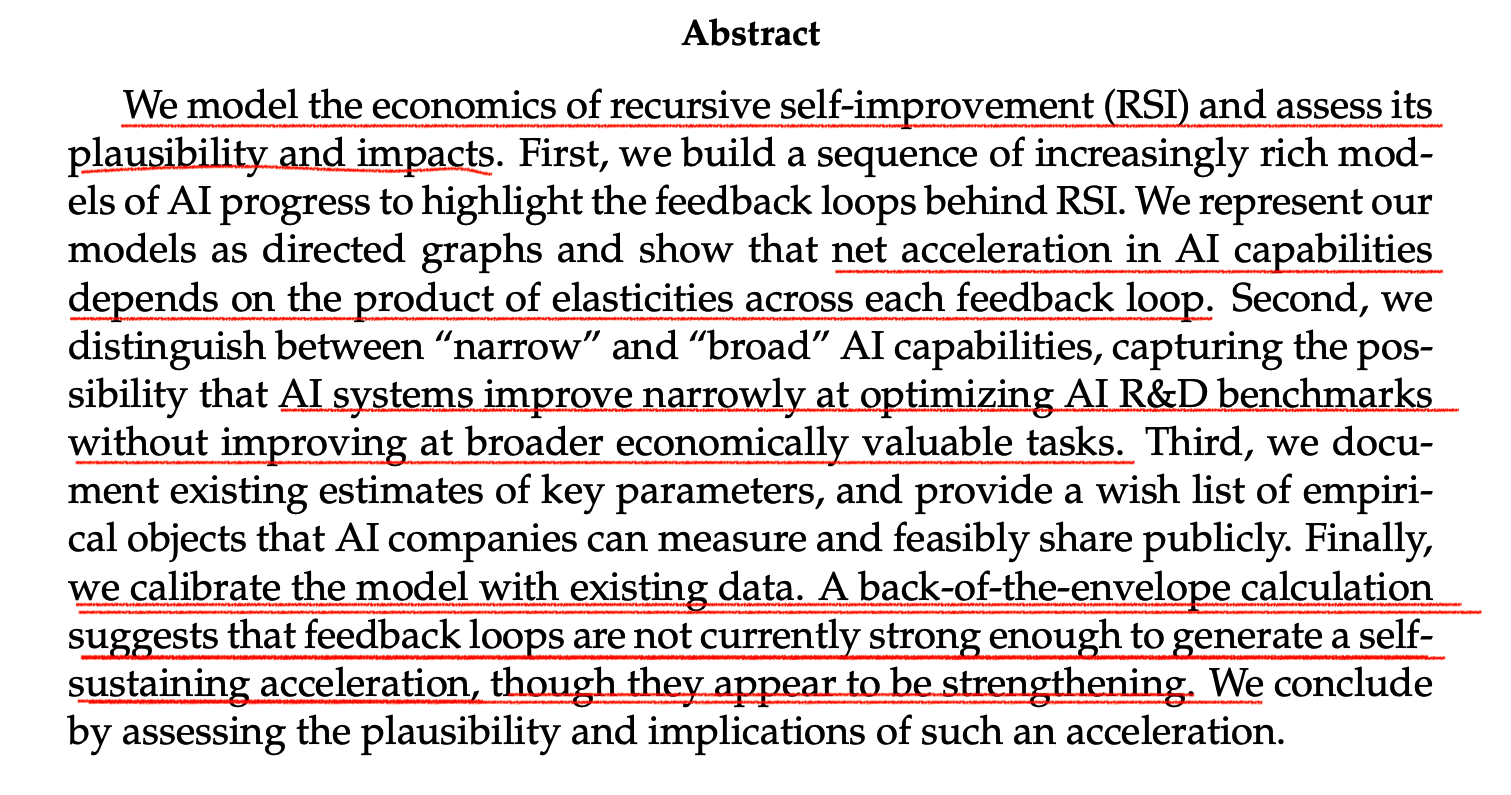
Click here to open the paper and view the abstract in context ↗
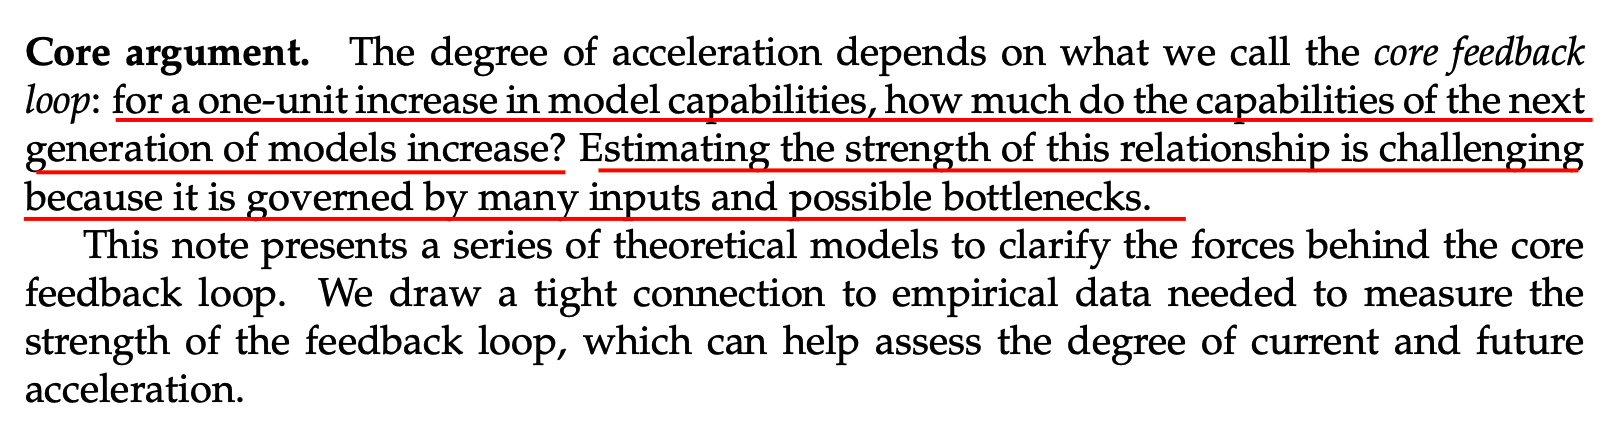
Click here to open the paper and read the full core argument ↗
This paper and the ideas are all about elasticities. Elasticity is a measure of responsiveness: how much one thing changes when another changes. In RSI, the elasticities along the loop - better AI → better R&D → better algorithms → better AI - multiply together.

If one round of improvement produces at least one equally large next round, the loop can sustain itself; if not, progress still requires more people, compute or data.
Definition · Elasticity
An elasticity measures the percentage change in Y caused by a 1% change in X, holding other inputs fixed.
1 × ???? × 6.5 ≈ 11 × 15% × 6.5 ≈ 1
01
Redefining RSI: self-sustaining acceleration
Click here to open and watch the full Dwarkesh Patel conversation on YouTube ↗
“Whether or not this turns out to be the case, I think is the most important question in the world right now.”— Dwarkesh Patel, conversation with Ryan Greenblatt ↗
In 1965, mathematician I. J. Good proposed that an ultraintelligent machine could design superior successors, causing an unstoppable intelligence explosion.

“An ultraintelligent machine could design even better machines; there would then unquestionably be an ‘intelligence explosion.’”— I. J. Good, 1965 ↗
The term “recursive self-improvement” (RSI) has been used in several ways, often inconsistently.
Broad definitions
Technology aids its own improvement. This is too broad to be useful—many technologies already do this.
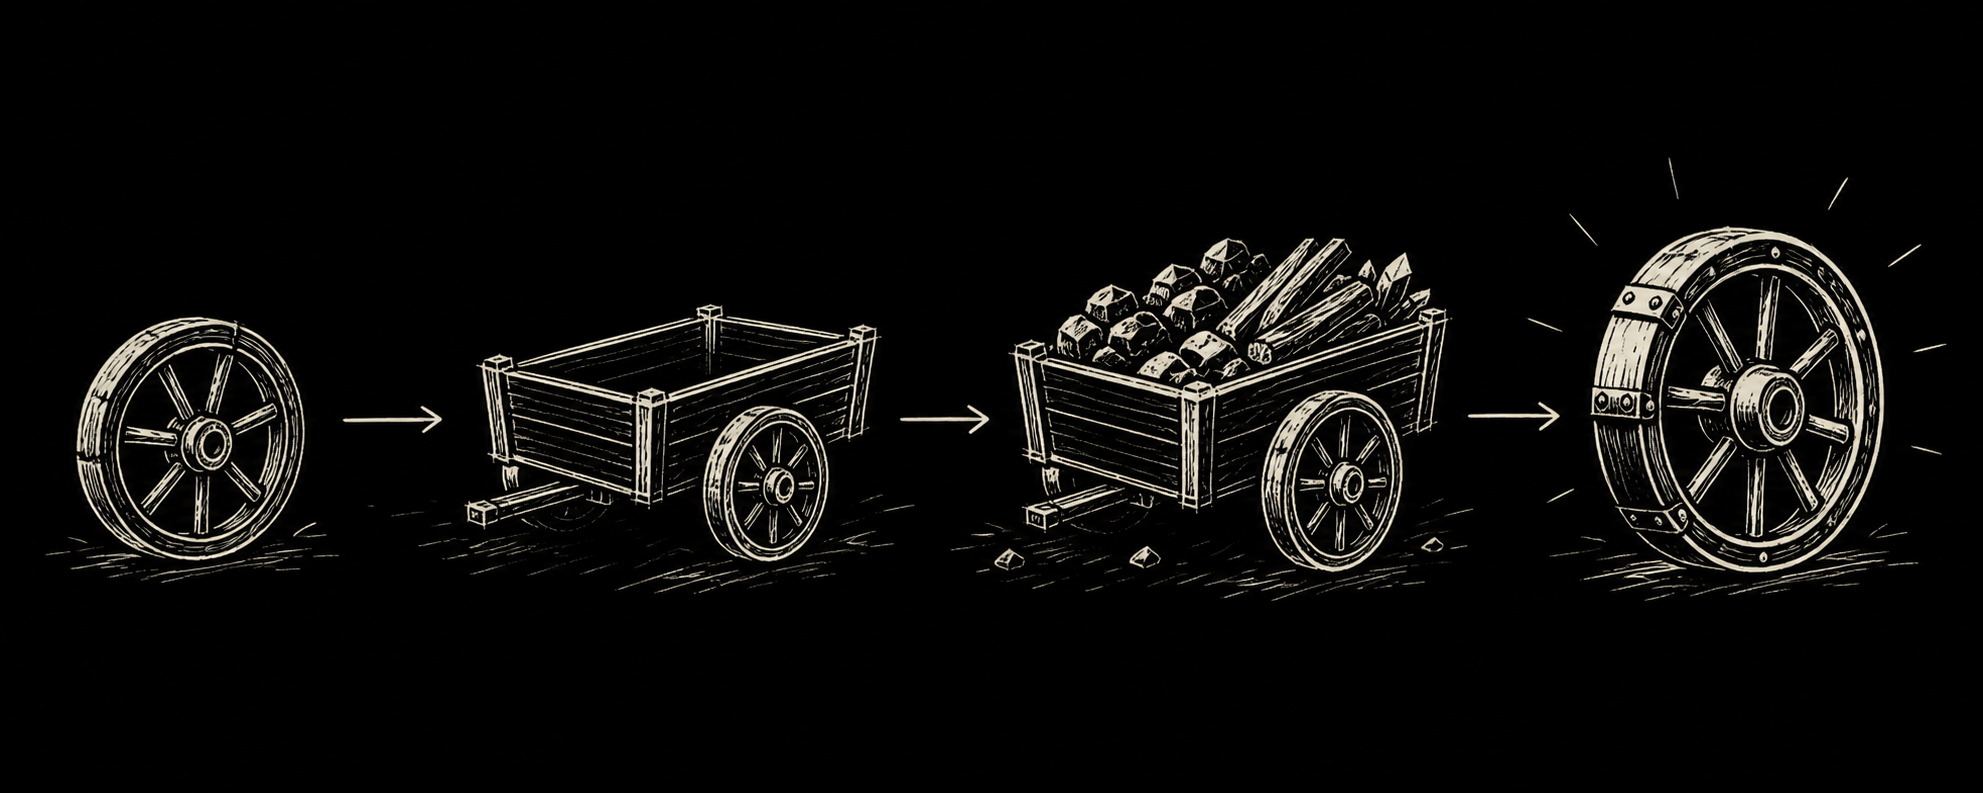
Click here to read the paper’s discussion of broad and narrow definitions of RSI ↗
Narrow definitions
AI systems independently choose research goals, run experiments, implement changes, and deploy successors. This assumes full agency.

Click here to read why the paper focuses on self-sustaining acceleration rather than full autonomy ↗
The paper redefines RSI as
Self-sustaining accelerationAI capabilities accelerate technological progress without growth in exogenous inputs such as human labour, training compute or data.02
How do you compare model improvements across different benchmarks, over time?
To measure RSI, we need to compare model capability - between models, over time over different and quickly saturated benchmarks. This is hard.
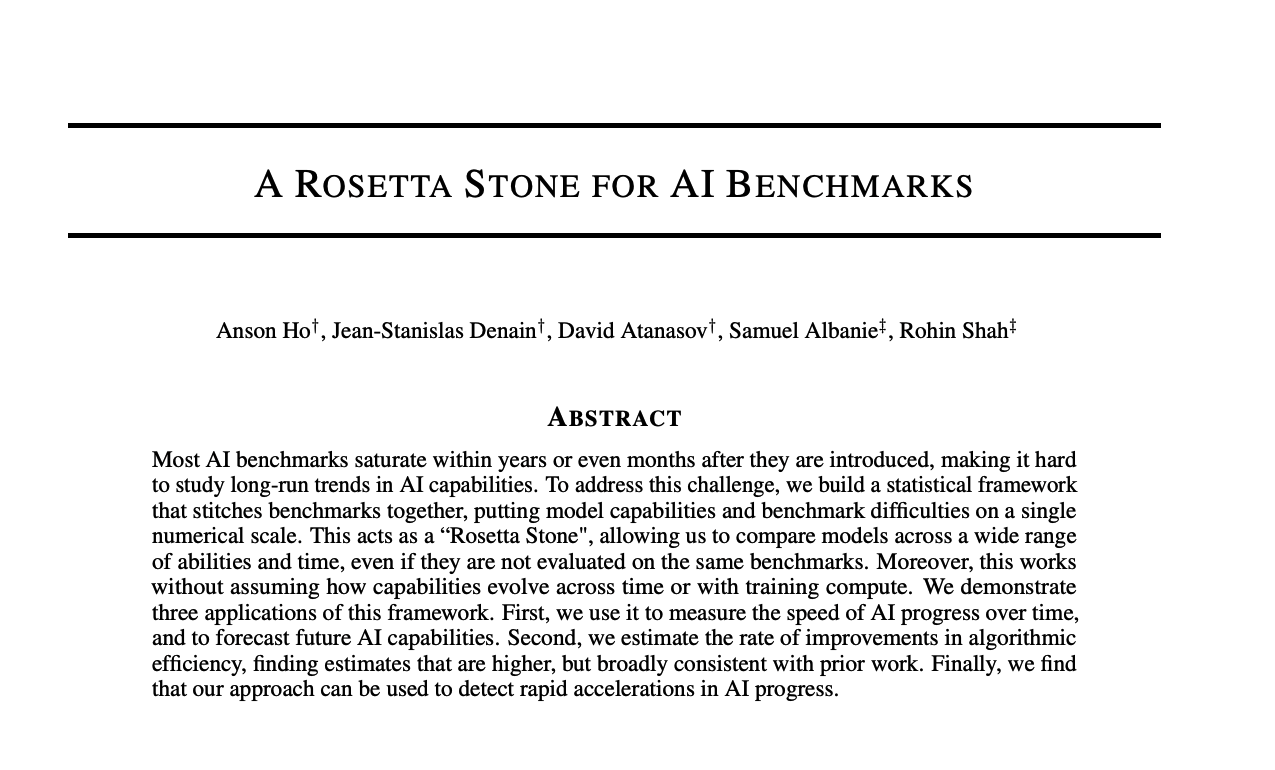
Click here to open and read A Rosetta Stone for AI Benchmarks ↗
179 models, 38 benchmarks, and 1,324 scores. The current public ECI has expanded to 50+ benchmarks.

Click here to open and explore Epoch AI’s full benchmark catalogue ↗
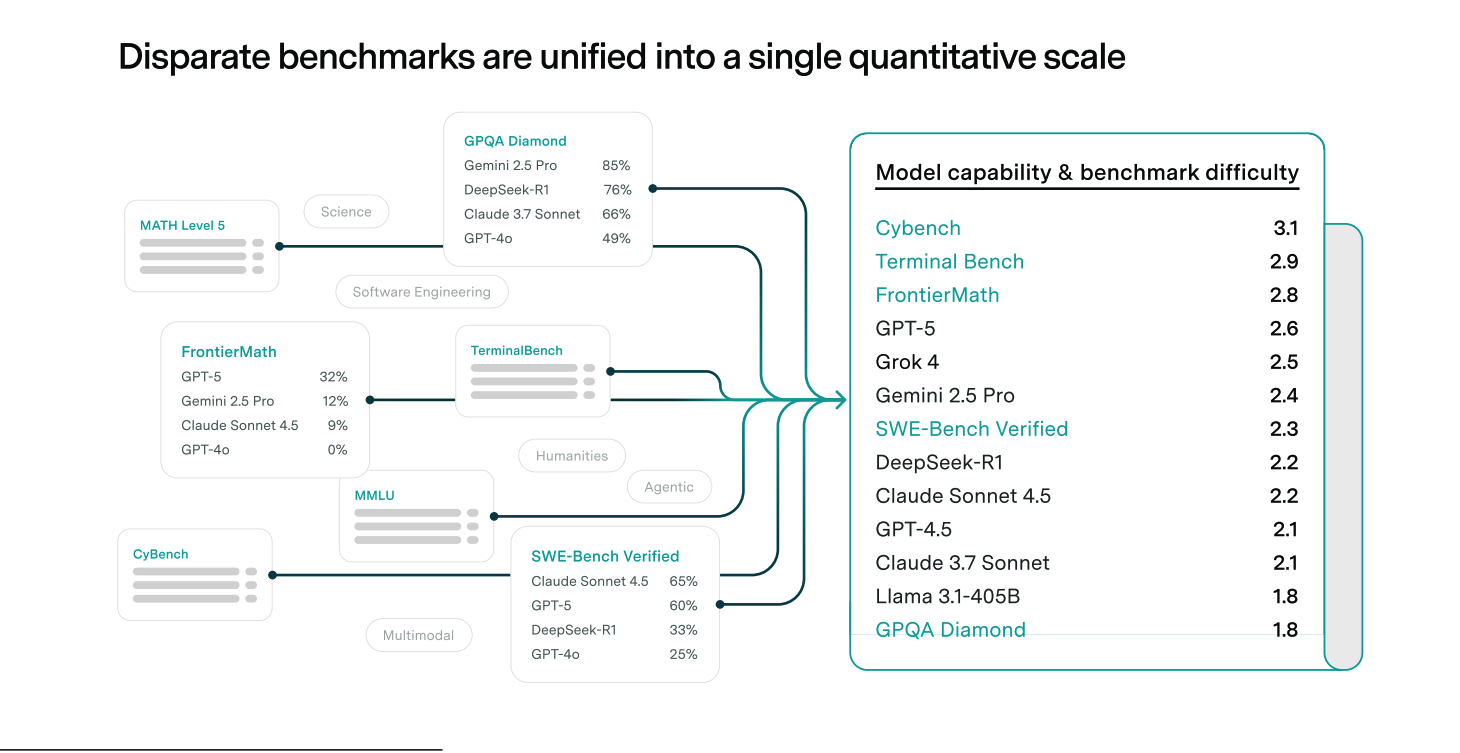
Click here to read how Epoch stitches different benchmarks into one capability scale ↗
ECI is the public index built from that paper.
The Epoch Capabilities Index (ECI) estimates:
- Each model’s capability
- Each benchmark’s difficulty
- How quickly each benchmark saturates
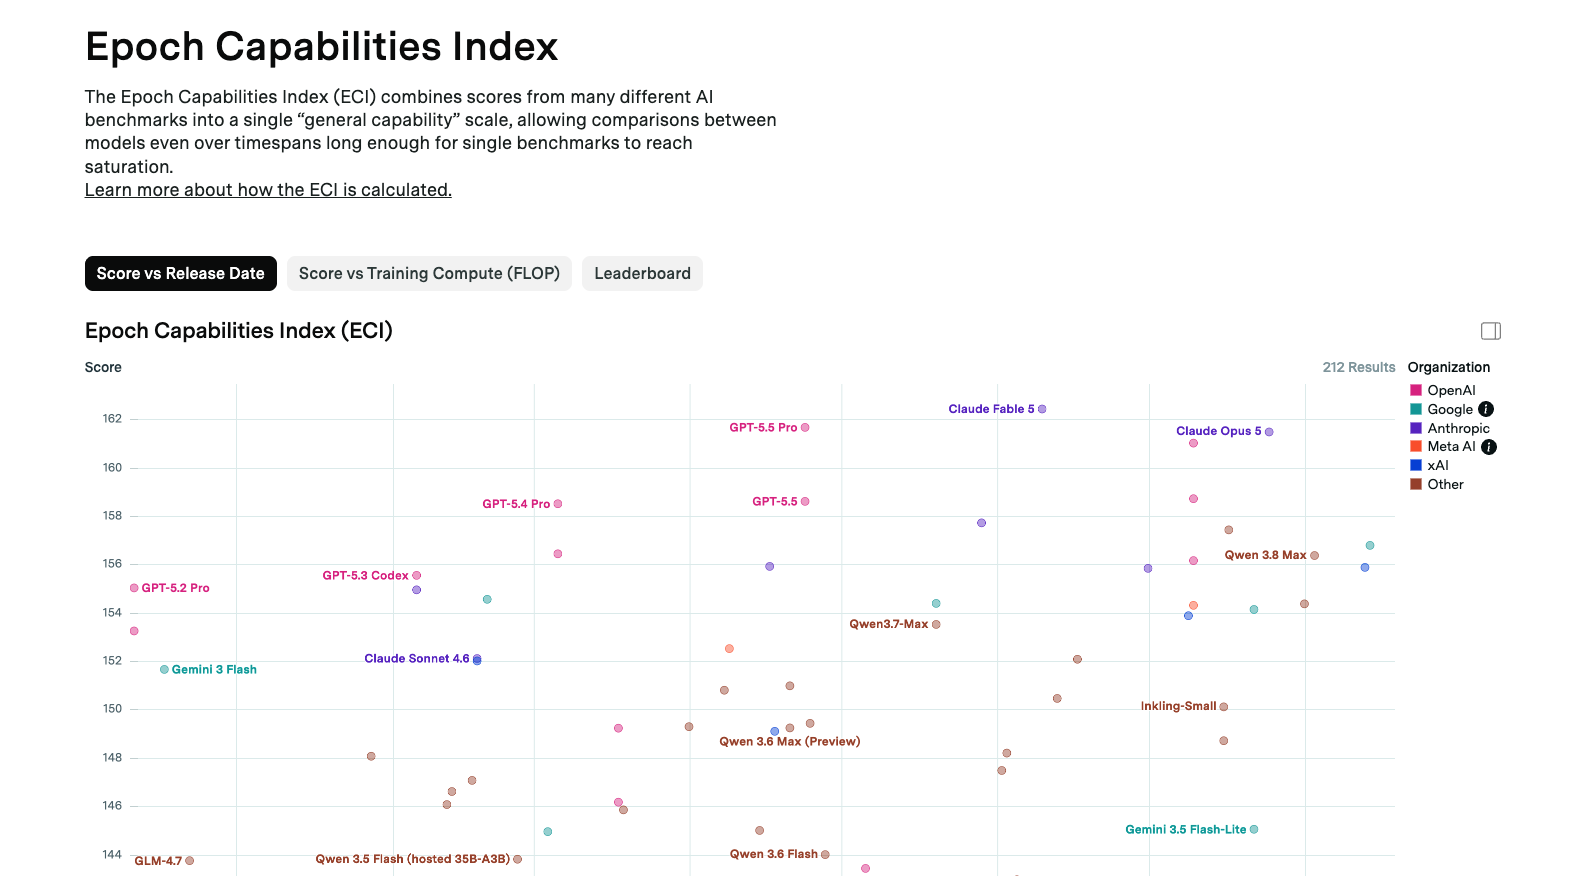
Click here to open and explore the live Epoch Capabilities Index ↗
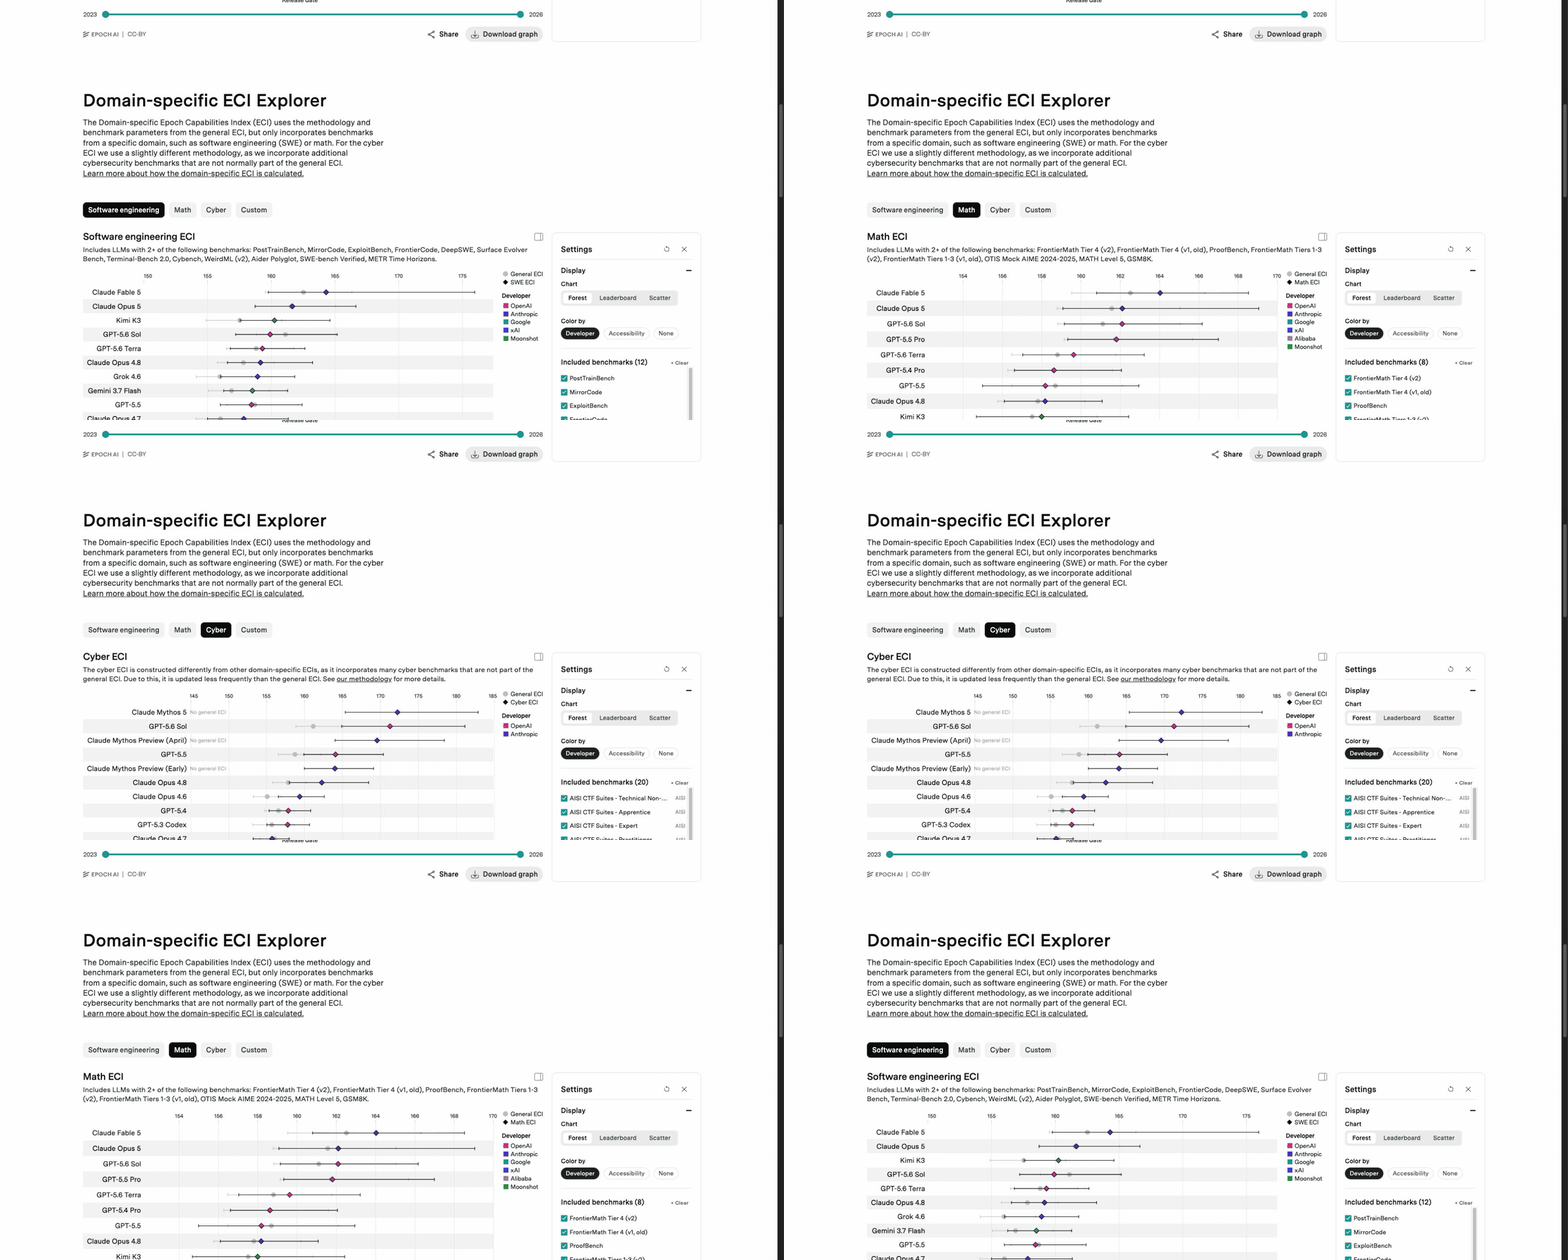
Click here to open the ECI and compare Software Engineering, Math and Cyber ↗
Models have a latent capability level, and the tests have a latent difficulty.
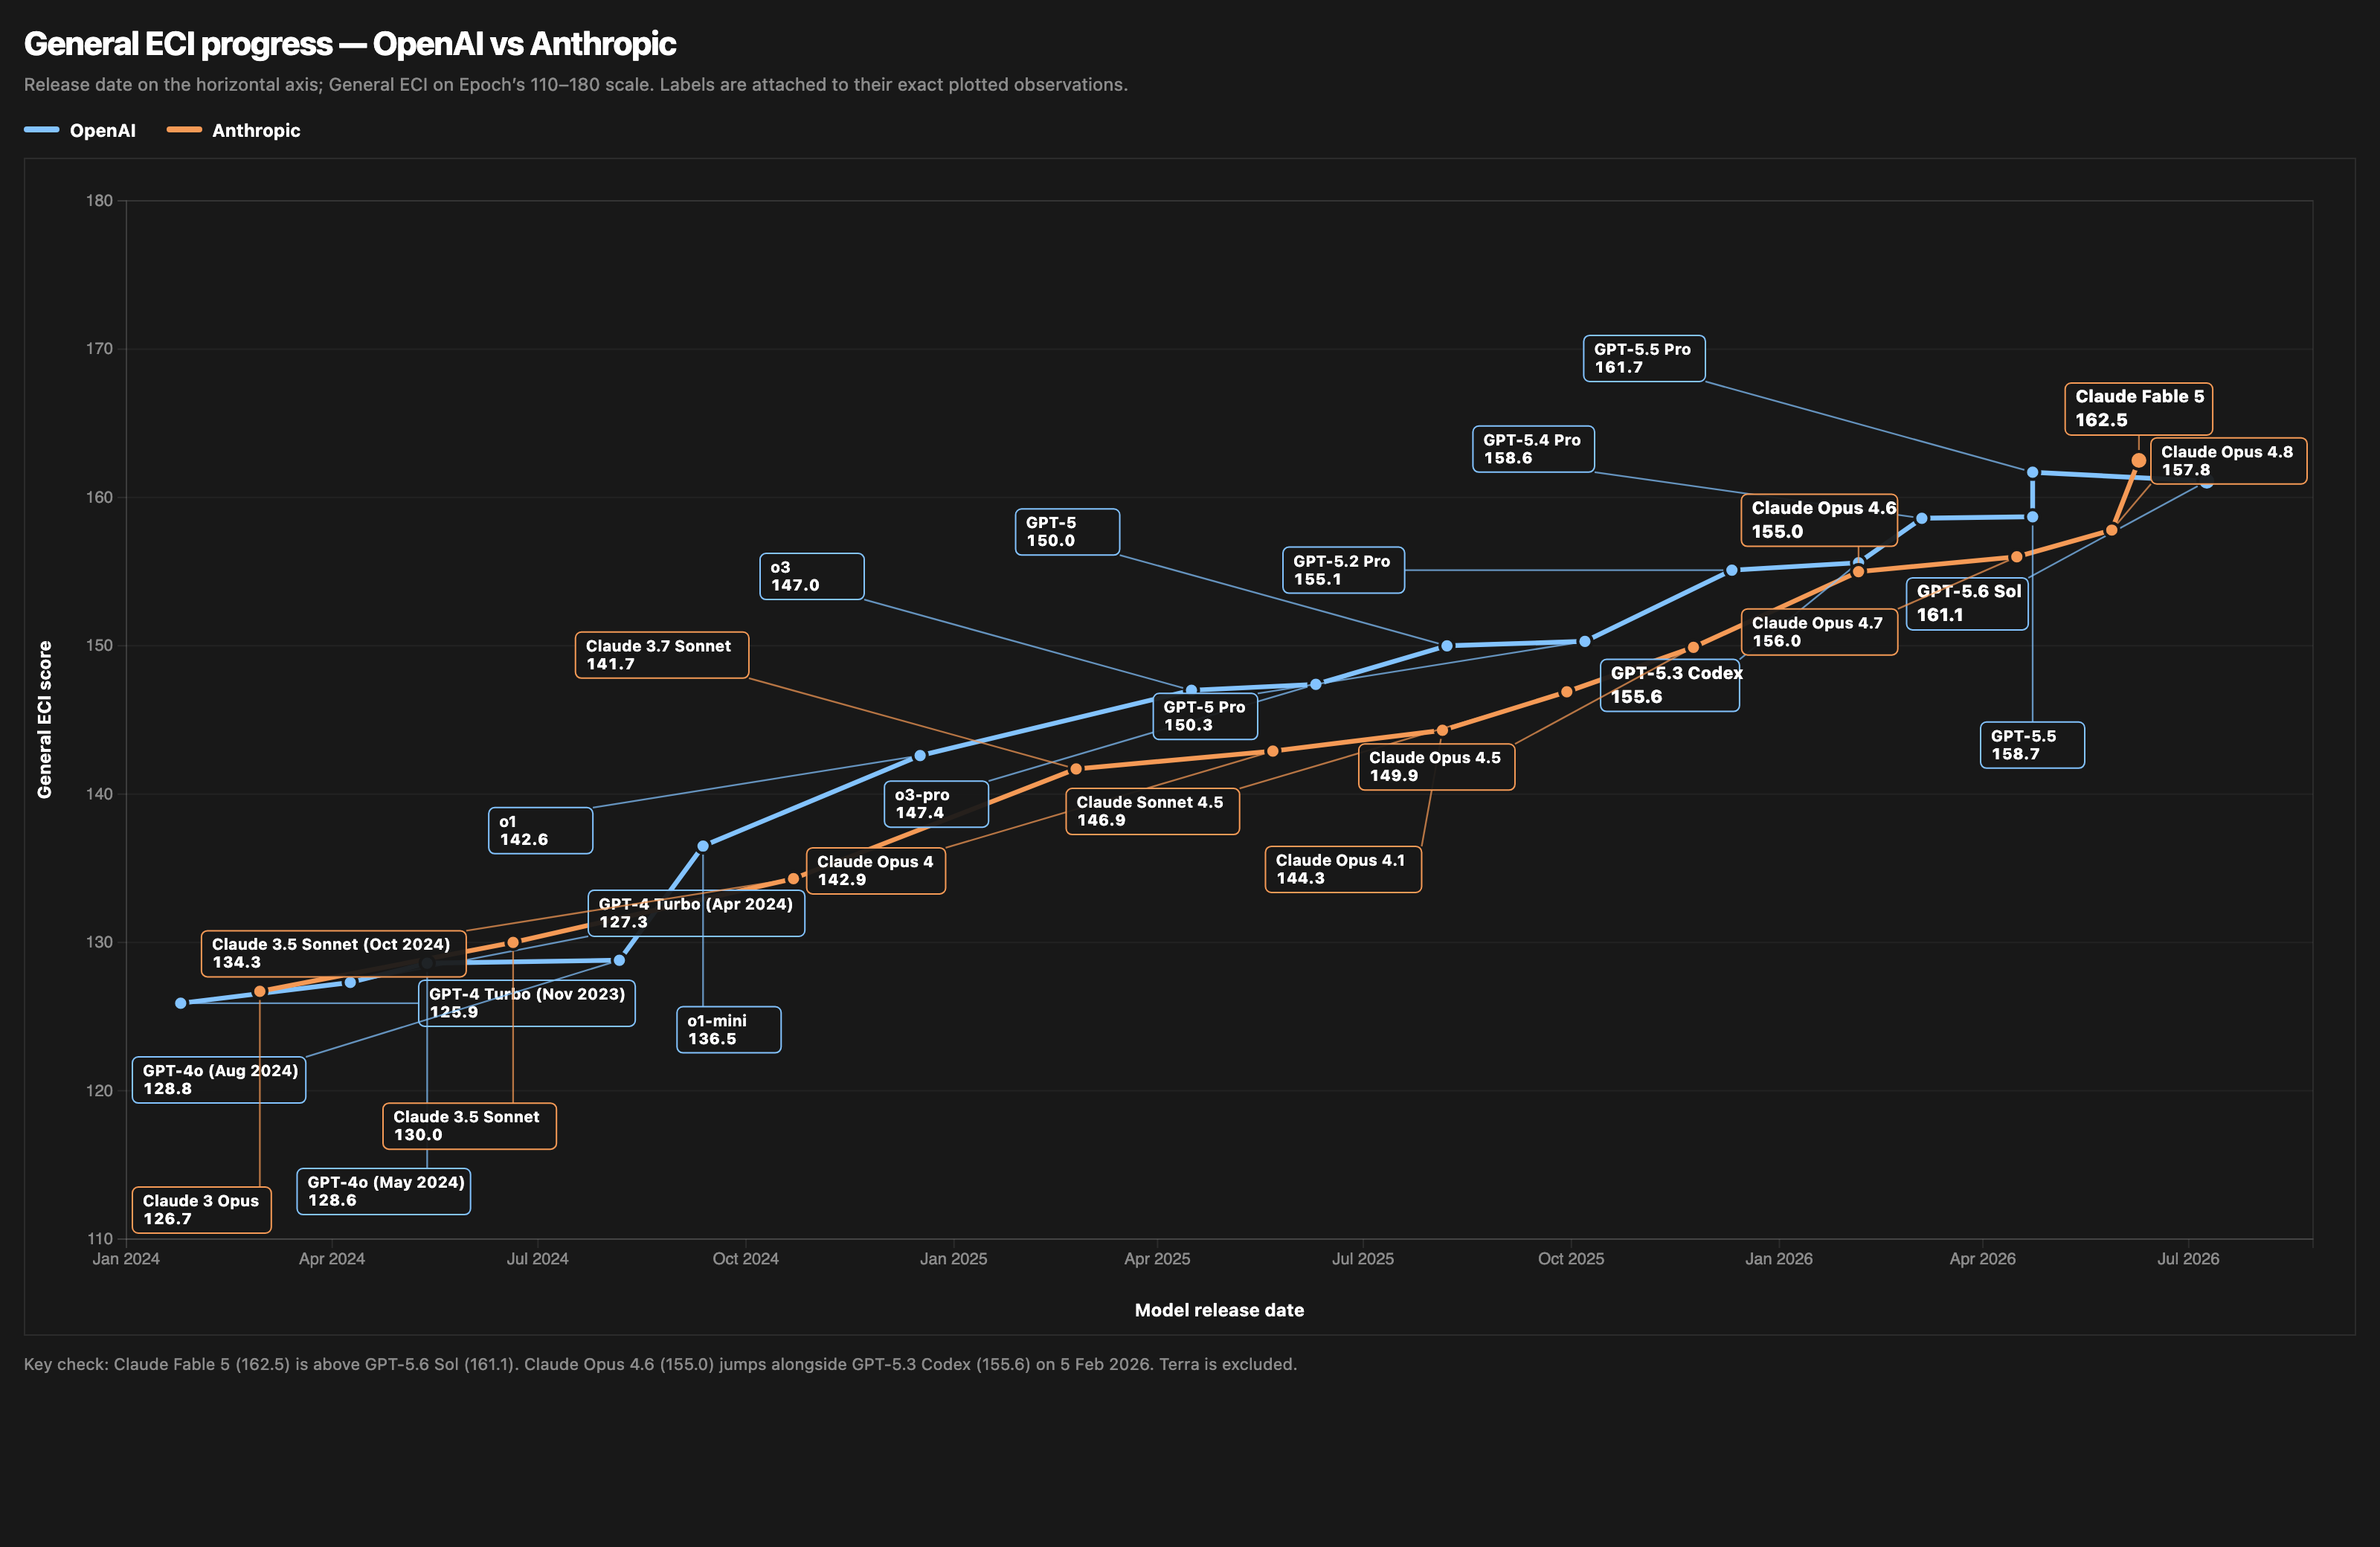
Click here to view OpenAI and Anthropic model progress in the live ECI ↗
We’ll come back to this.
03
How to model self-sustaining RSI?
The paper builds a bunch of different models of RSI. In the interests of time, we’re focusing on one.
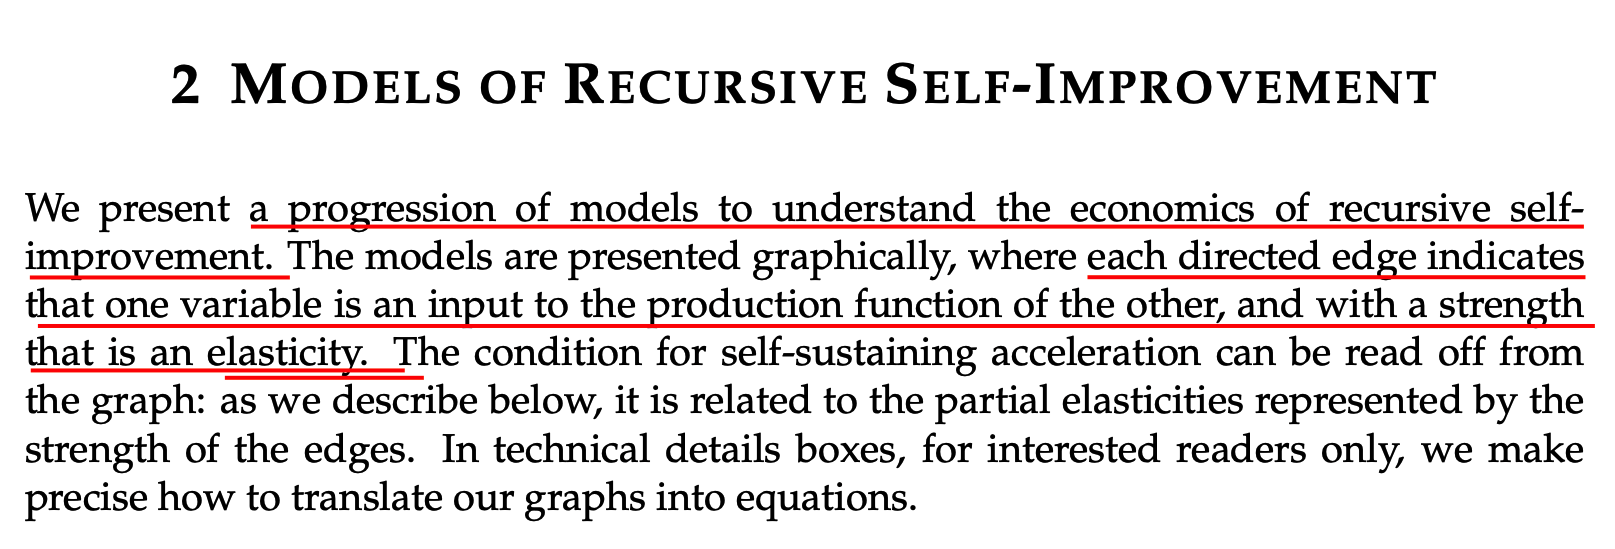
Click here to open the paper’s complete progression of RSI models ↗
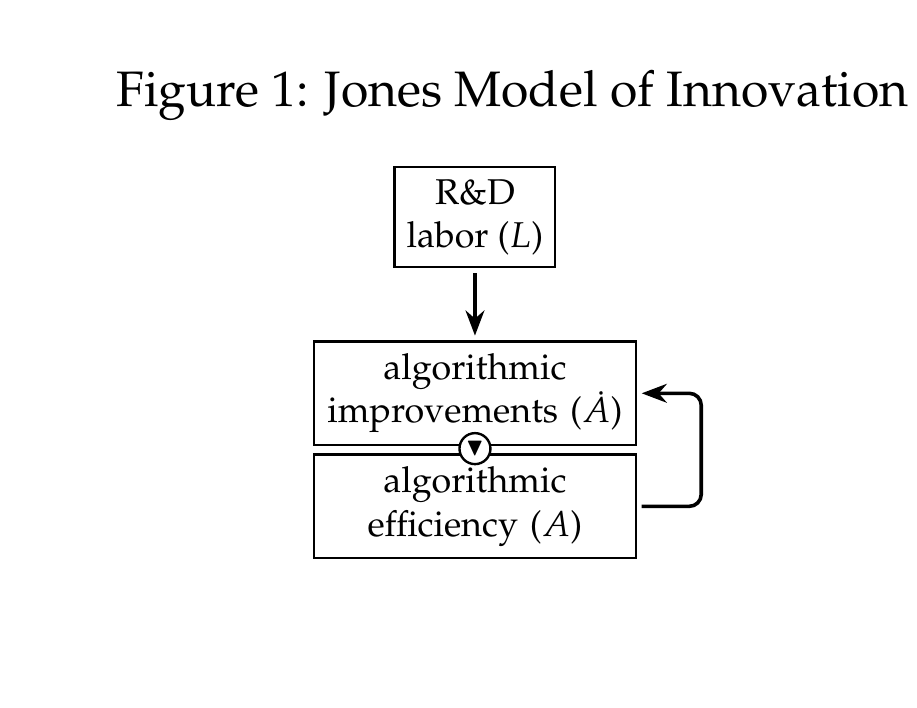
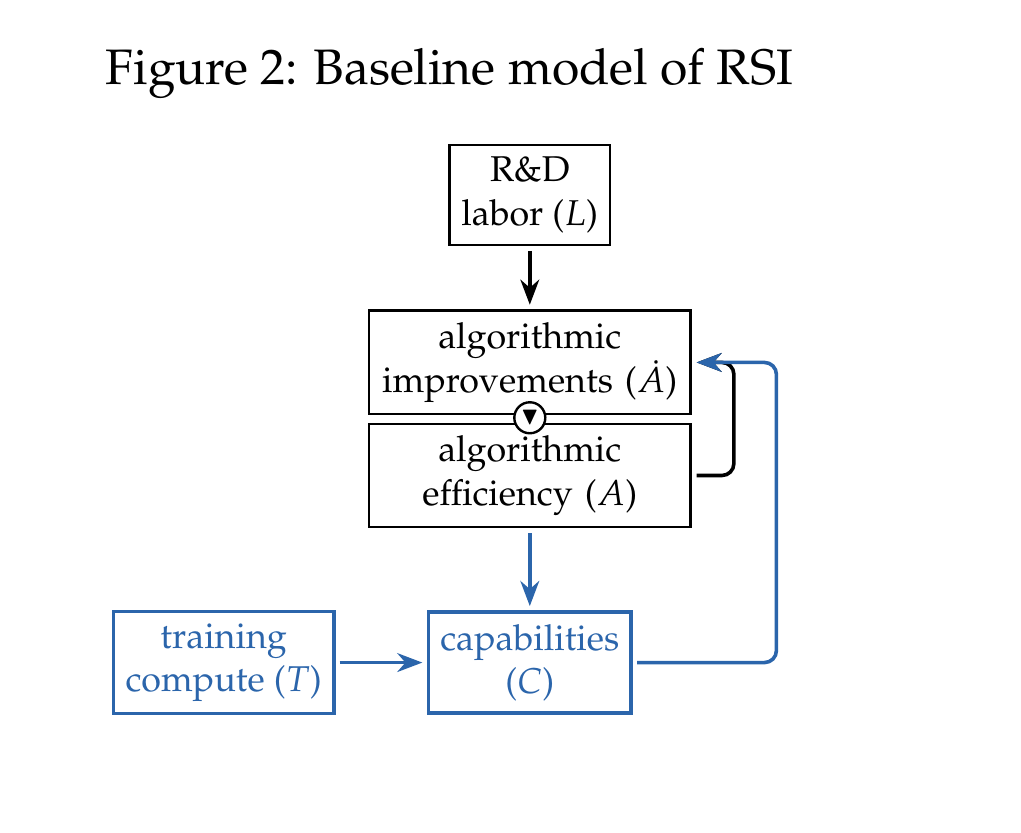

Simple intuition builder
To increase model capability: compute, data and better algorithms—and some humans.
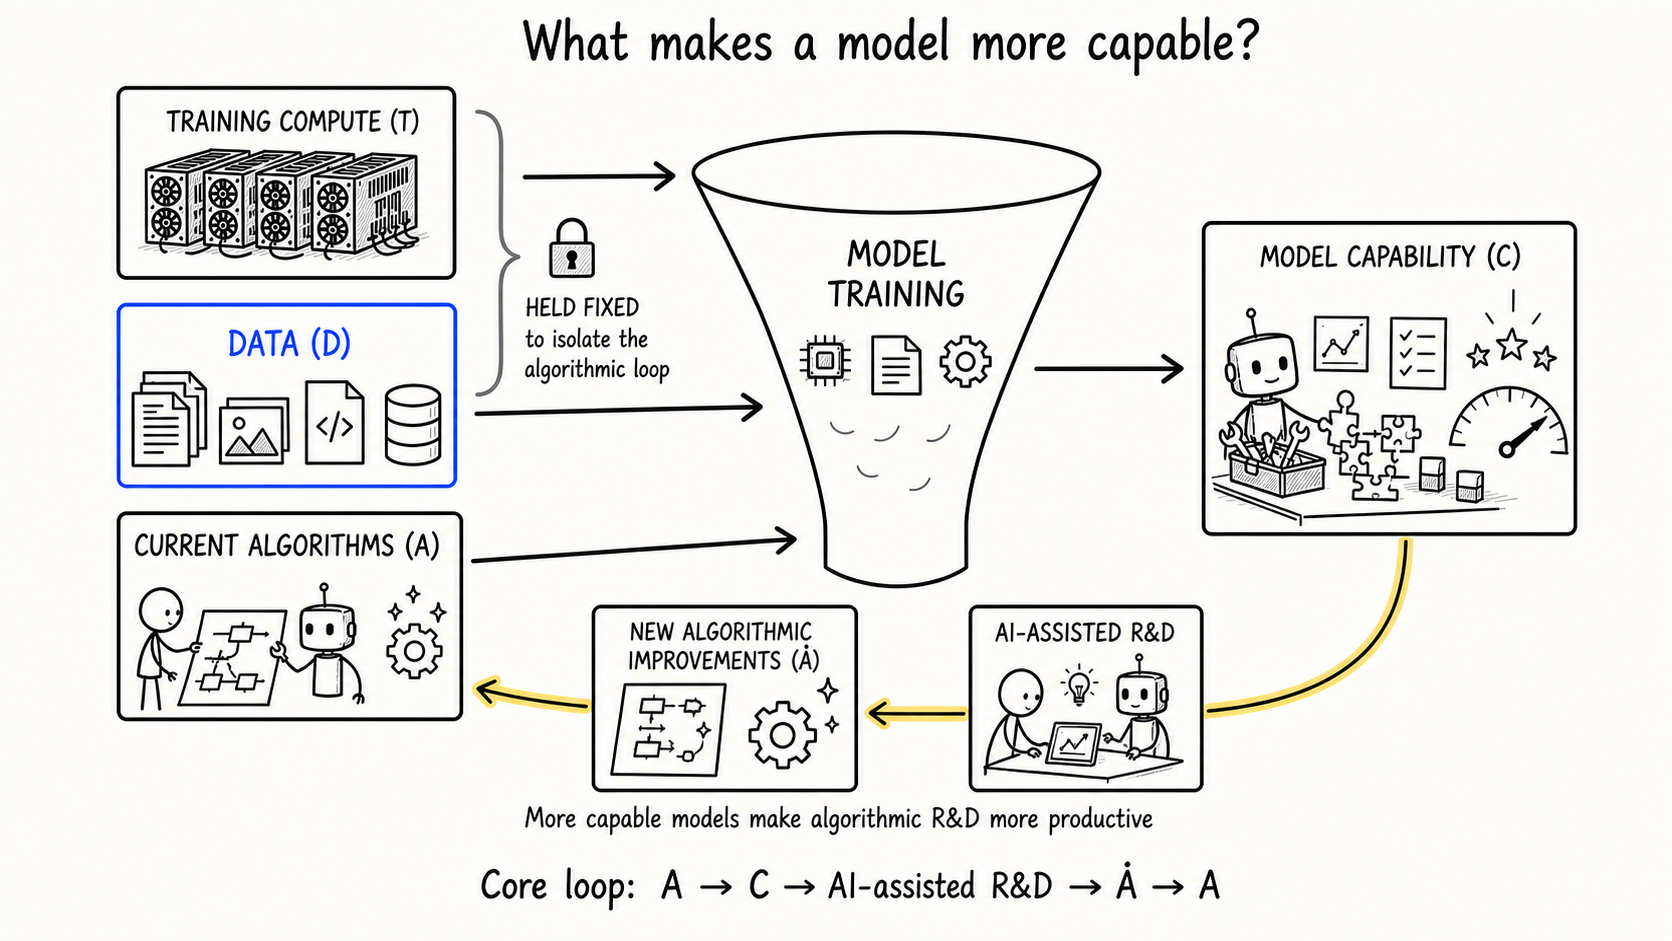
Click here to open the paper that this simplified capability diagram is based on ↗
Hold the exogenous stuff fixed, measure the core loop.
R&D → Better Algorithms → Better AI → Better R&D
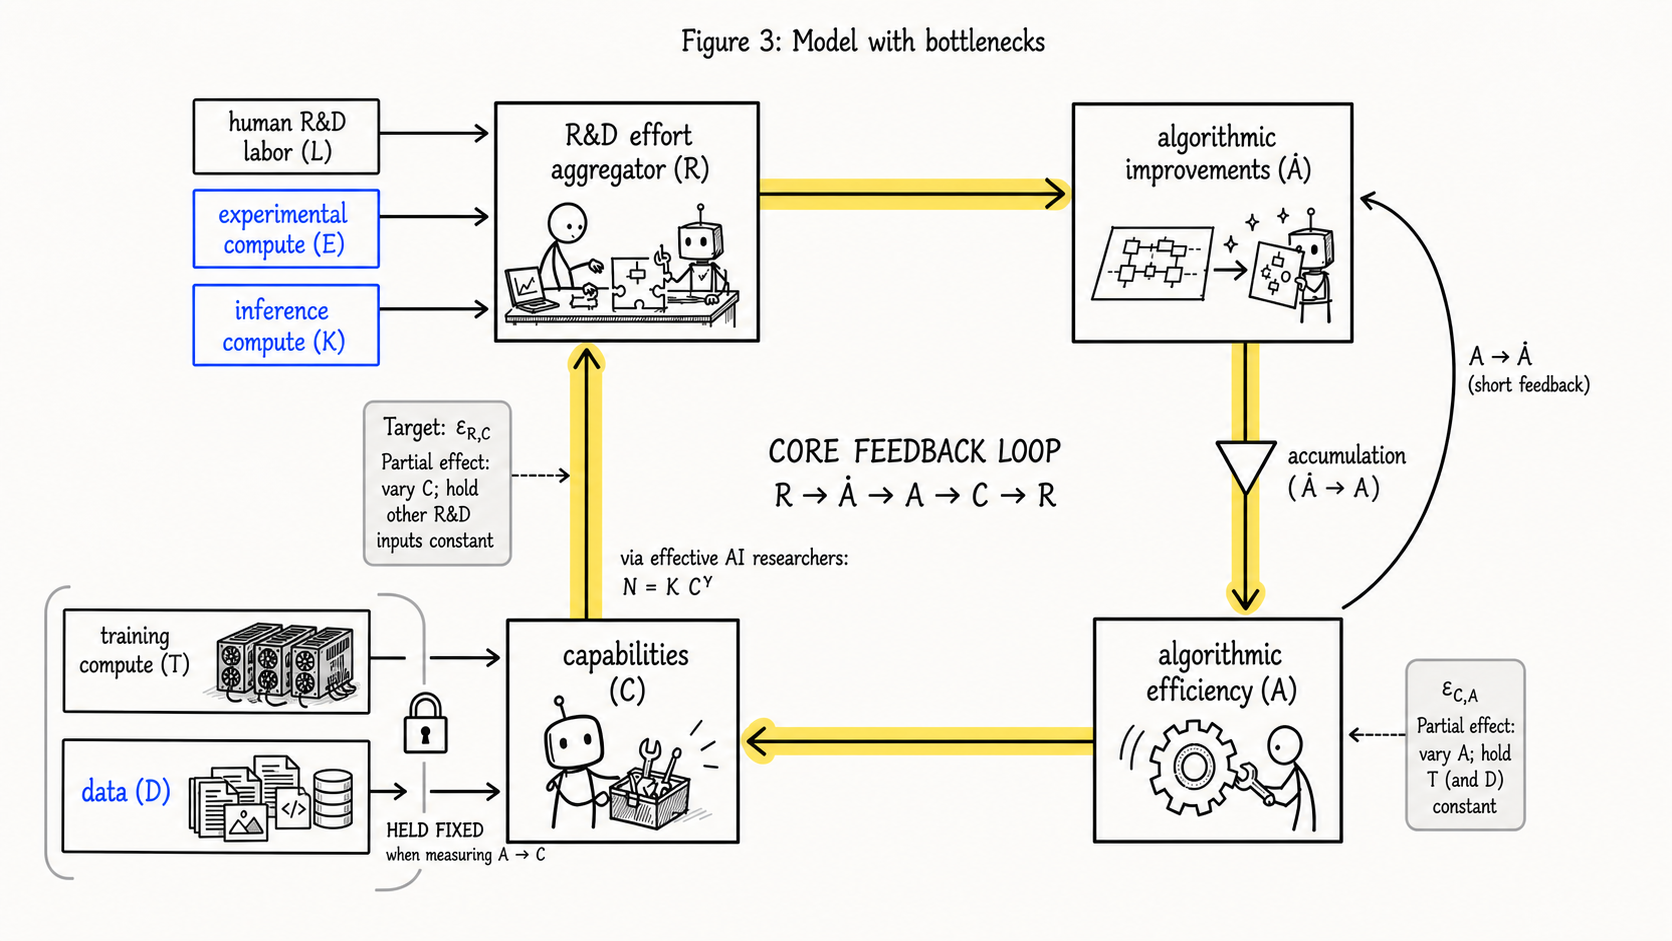
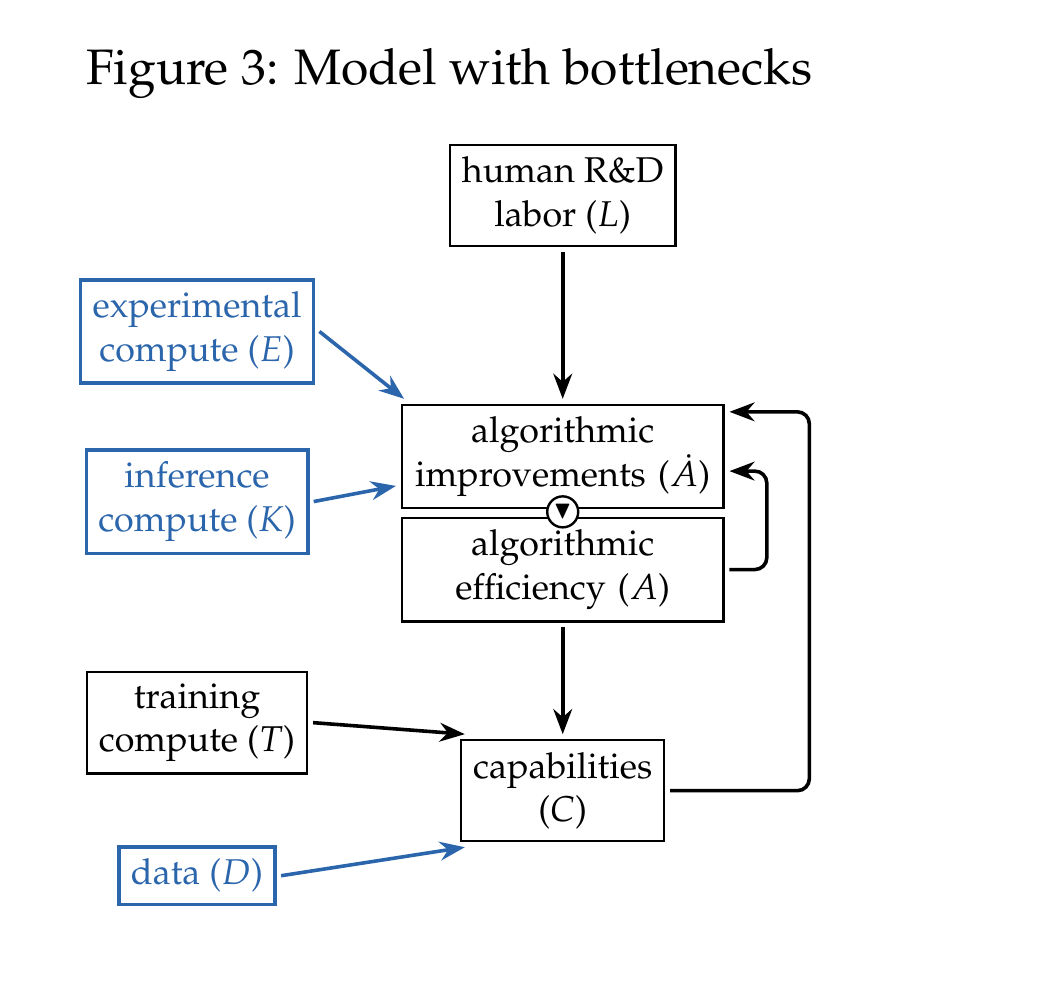
Click here to view the original Model with Bottlenecks in the paper ↗
Under the models (very rough) assumptions - if you hold the external inputs fixed, a one-ECI-point improvement must make total AI R&D about 15% more productive.
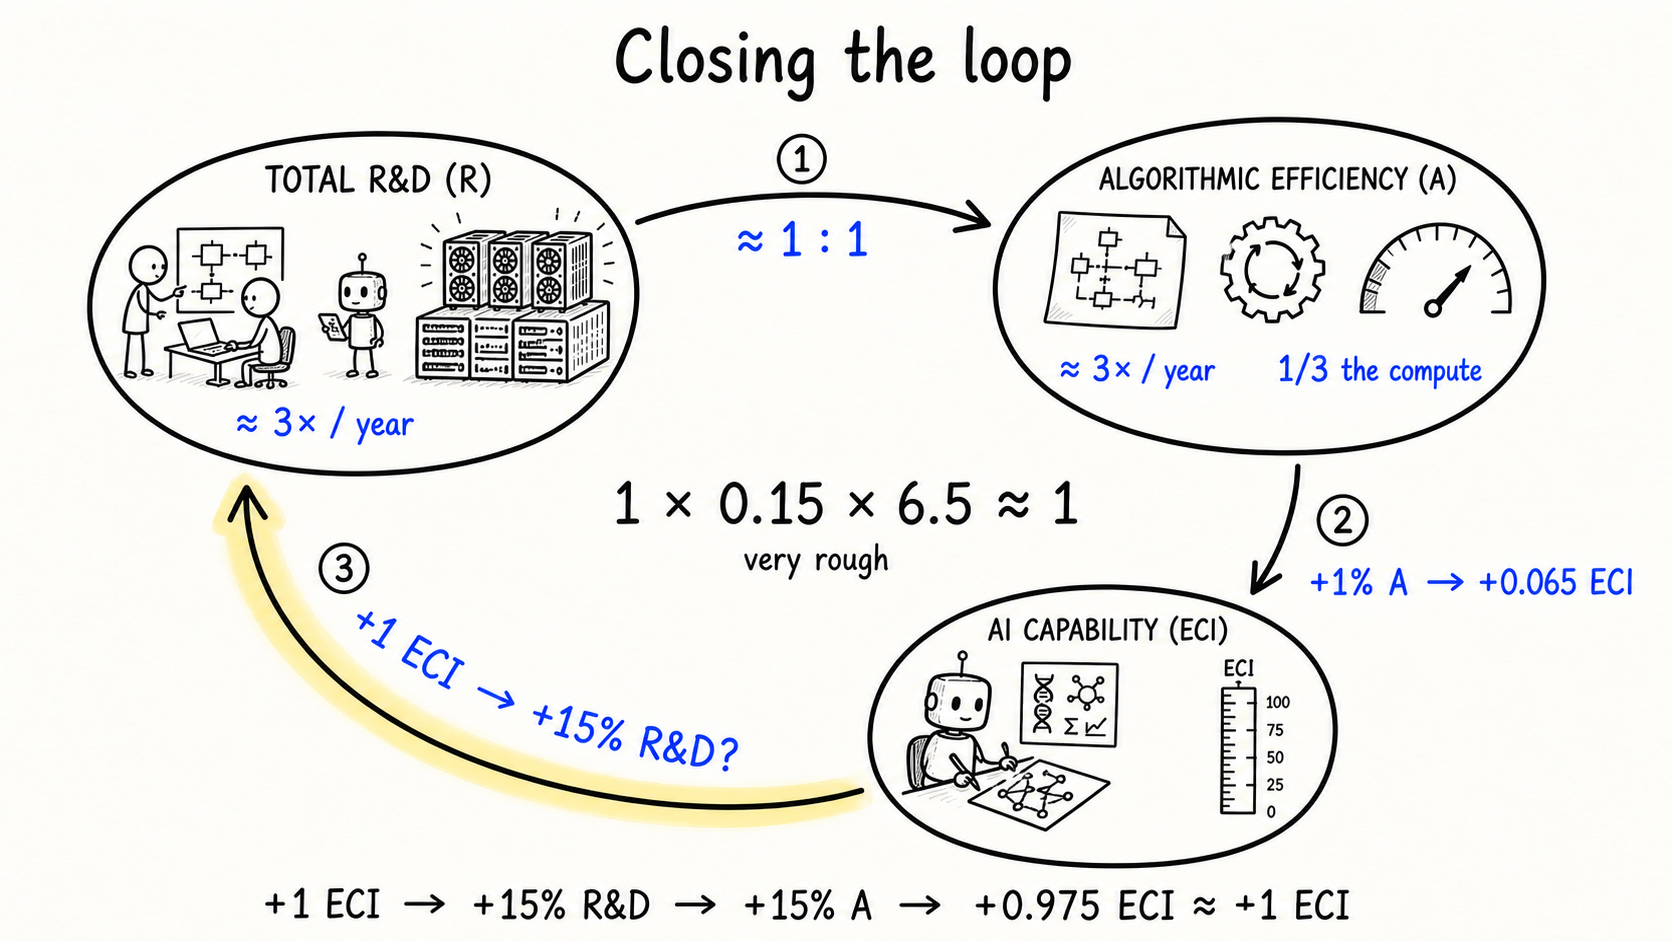
Click here to read the paper’s calibration of the three-link feedback loop ↗
This is the chain
- How much does total R&D contribute to algorithmic progress?
- How much do better algorithms improve AI capability?
- How much does better AI contribute back to total R&D?
1 × ???? × 6.5 ≈ 11 × 15% × 6.5 ≈ 1
04
Hypothetical Claude example
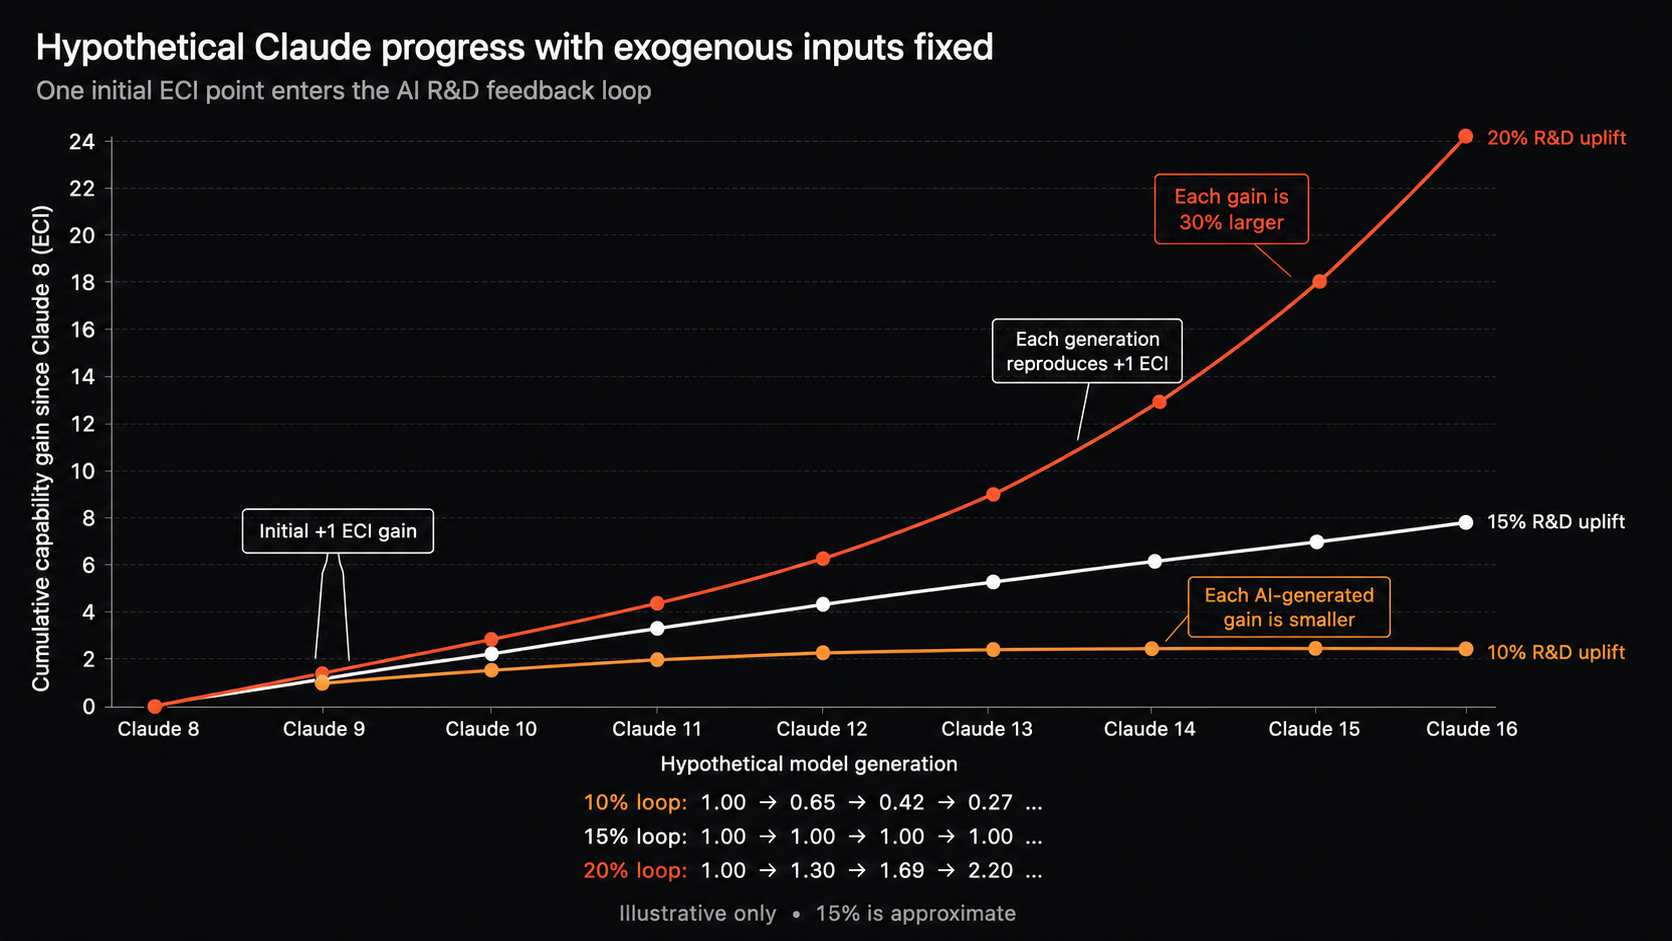
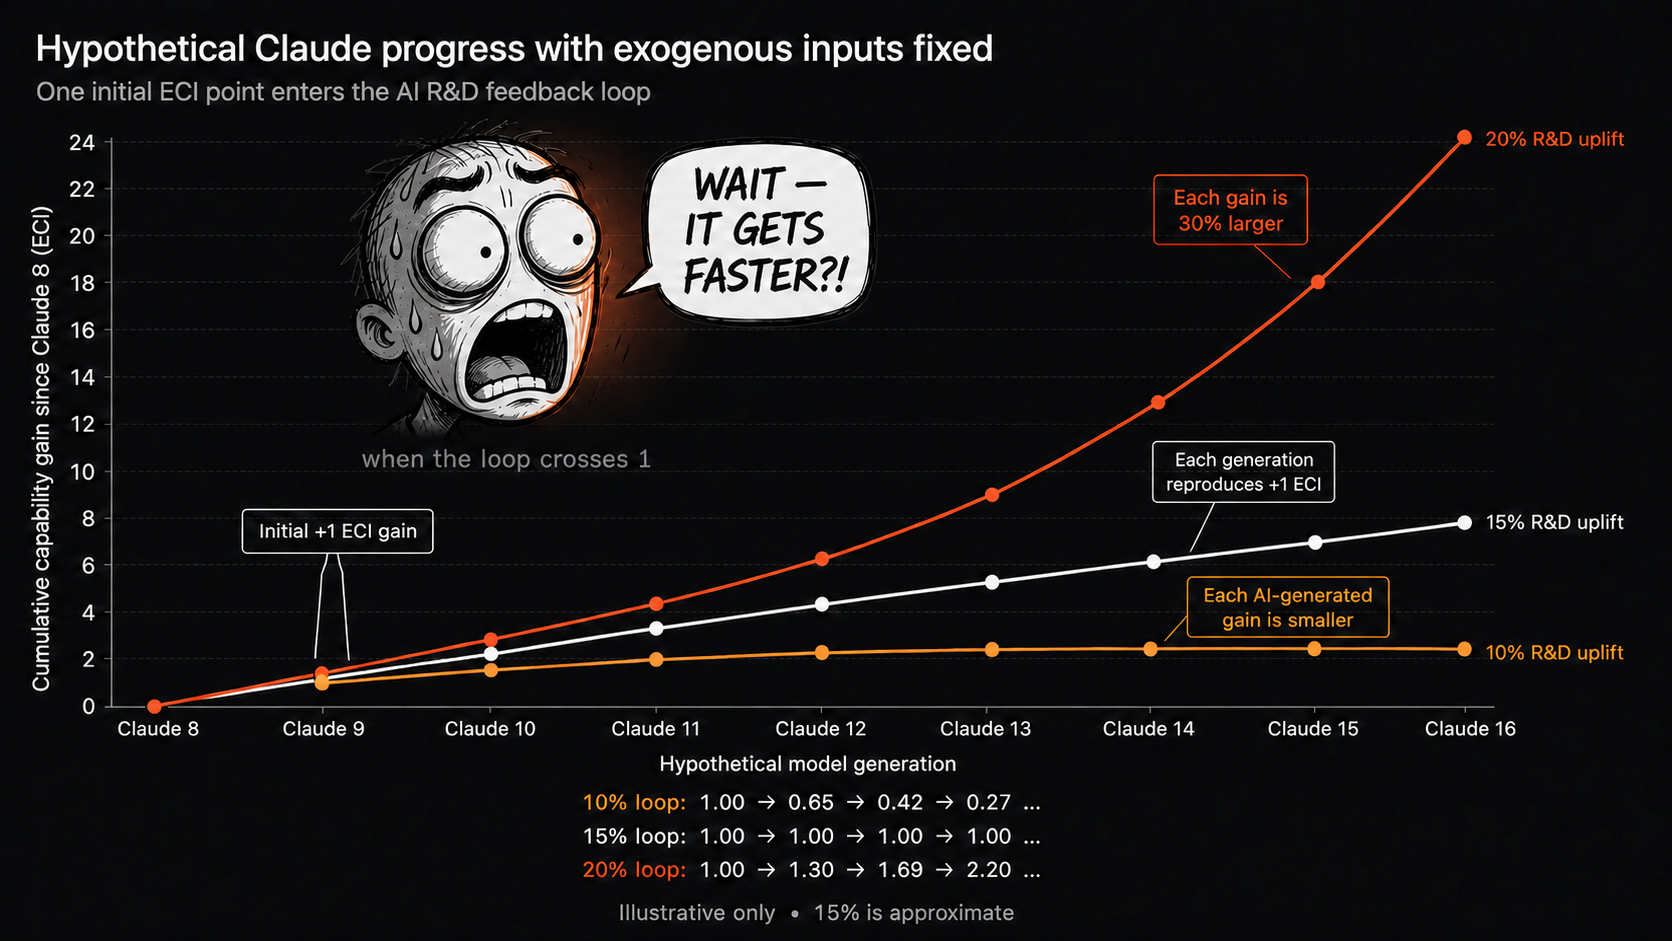
Imagine the following hypothetical: Claude 8, Claude 9, Claude 10, and so on—holding exogenous inputs fixed.
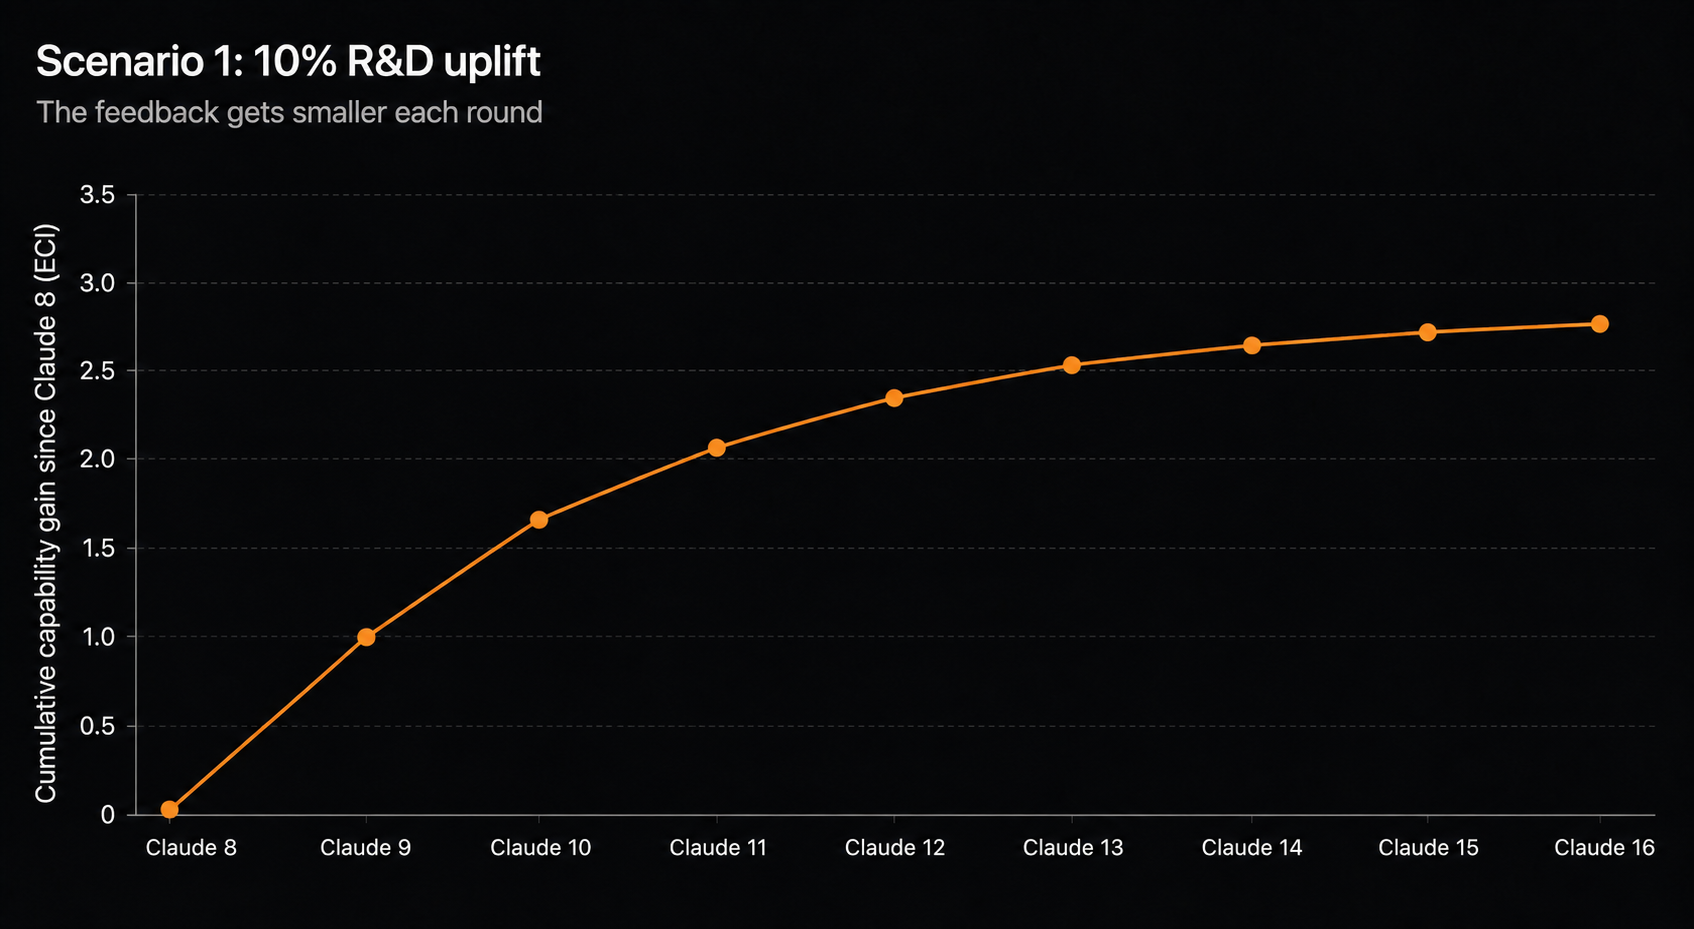
Scenario 1: 10%
Claude 9 is one ECI point more capable than Claude 8.
Suppose this makes total AI R&D 10% more productive.
- 10% more productive R&D produces roughly 10% better algorithms.
- 10% better algorithms produces roughly 0.65 ECI points.
1 × 10% × 6.5 = 0.65
The feedback gets smaller rather than reproducing itself, so it is not self-sustaining. Progress can still continue through additional compute, people, data and other outside inputs.
Click here to read the paper behind this illustrative trajectory ↗
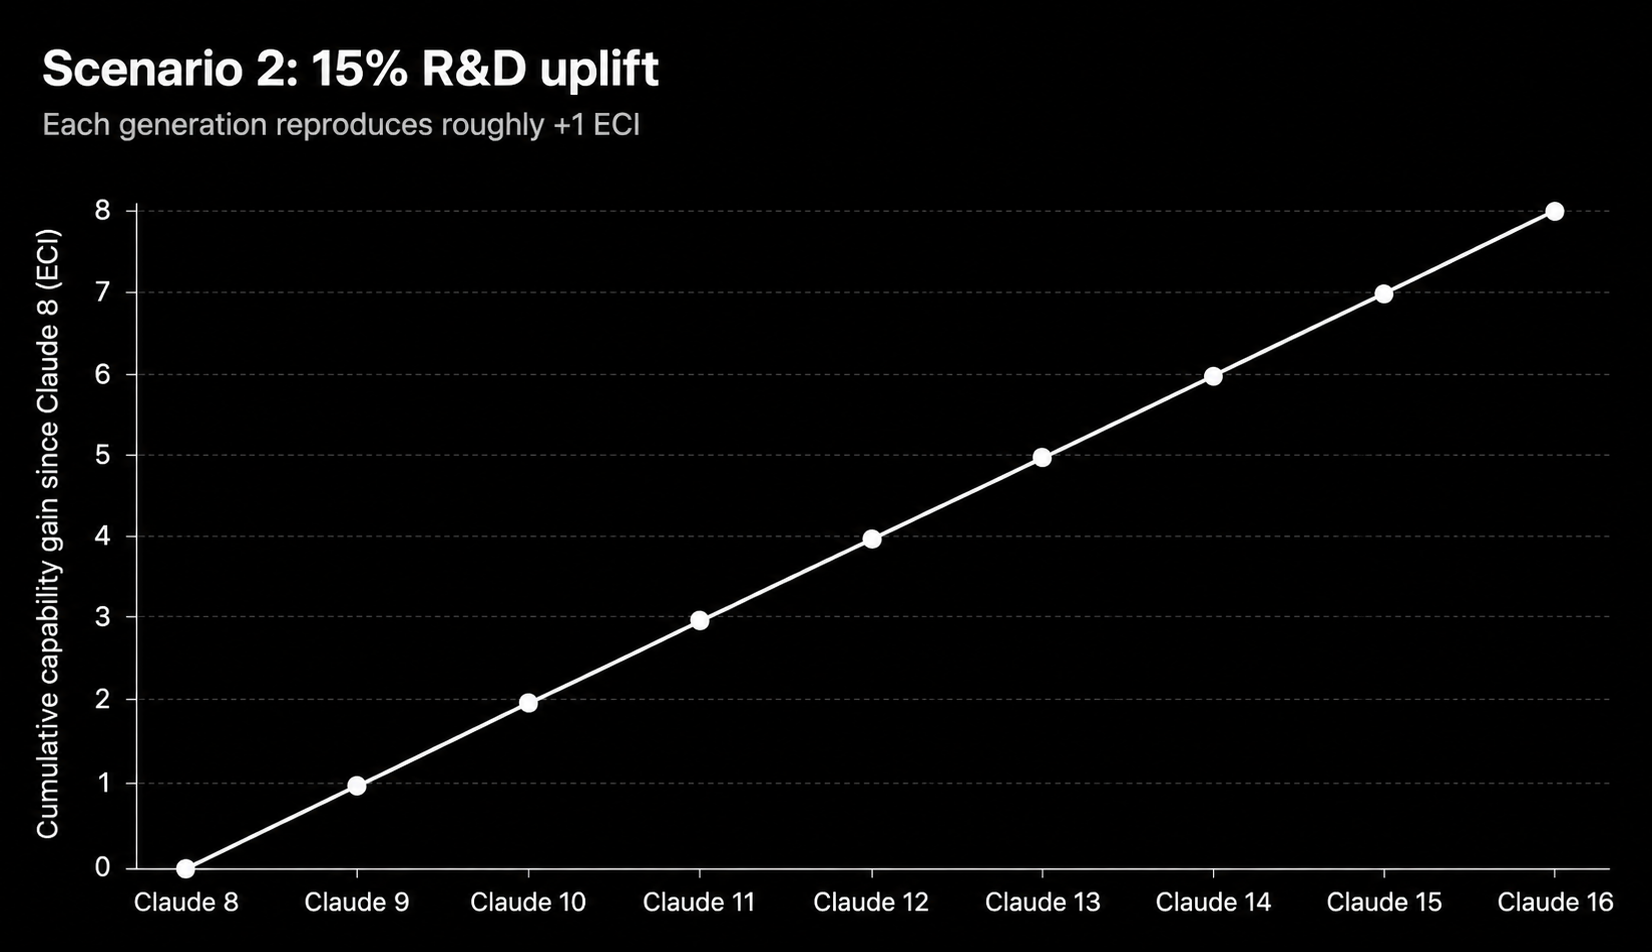
Scenario 2: 15%
Claude 9 is one ECI point more capable than Claude 8.
Suppose this makes total AI R&D 15% more productive.
- 15% more productive R&D produces roughly 15% better algorithms.
- 15% better algorithms produces roughly one additional ECI point.
1 × 15% × 6.5 ≈ 1
In this simplified hypothetical, the feedback loop becomes self-sustaining without further growth in outside inputs such as compute, people or data.
Click here to read the paper behind this illustrative trajectory ↗
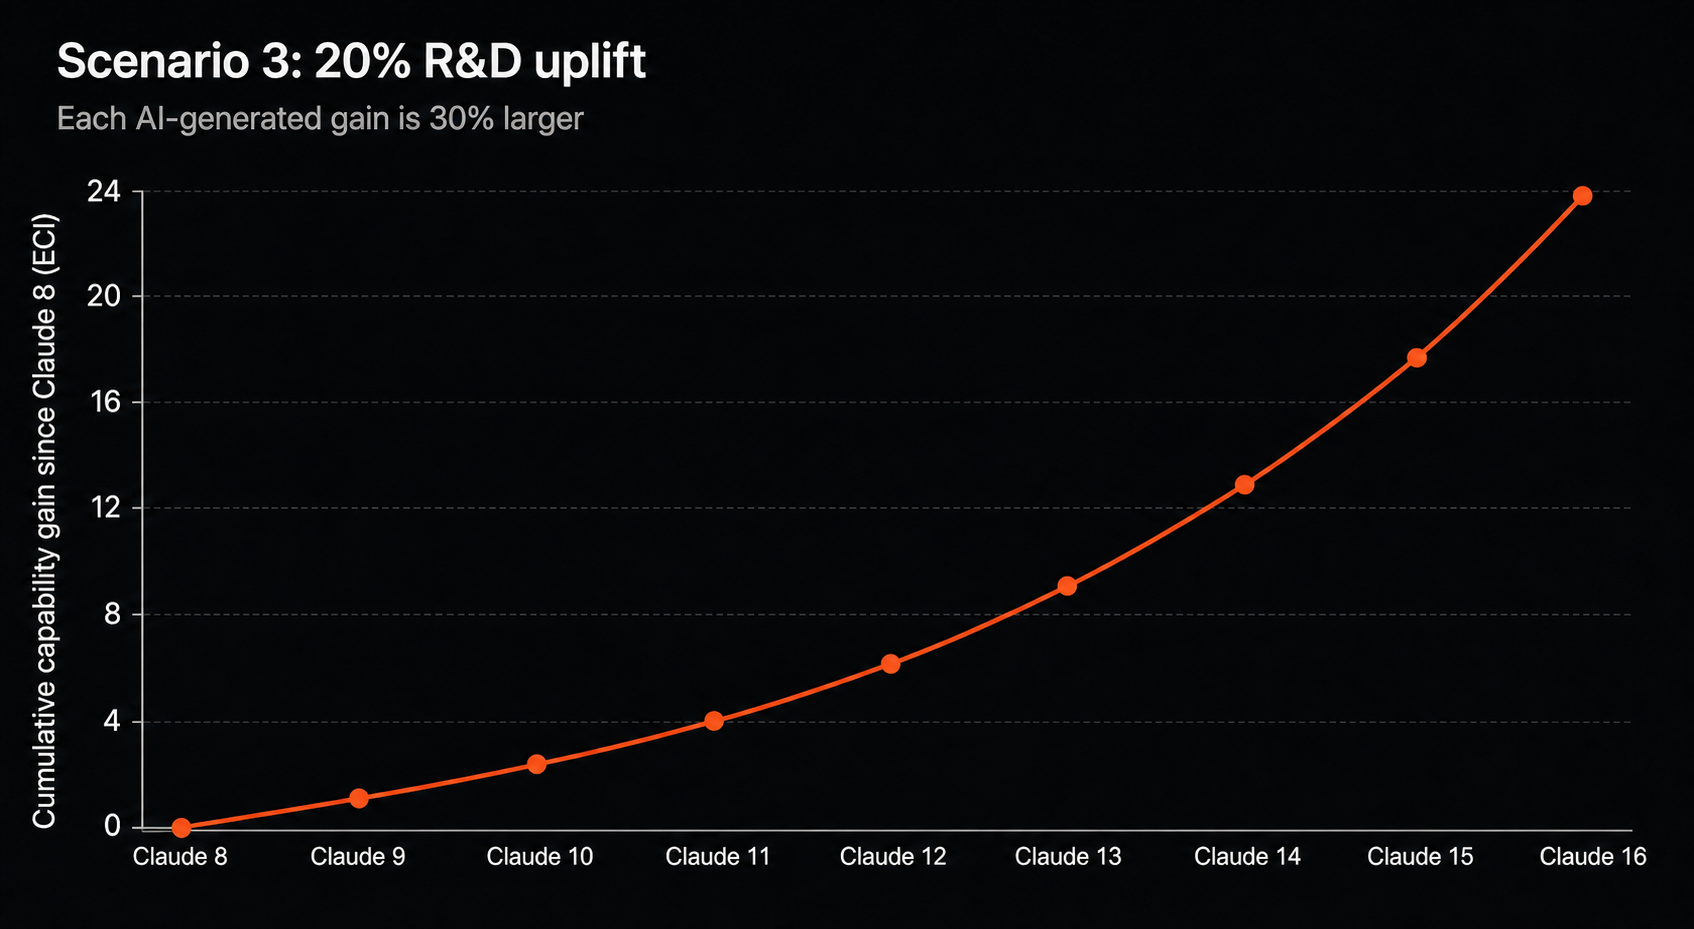
Scenario 3: 20%
Claude 9 is one ECI point more capable than Claude 8.
Suppose this makes total AI R&D 20% more productive.
- 20% more productive R&D produces roughly 20% better algorithms.
- 20% better algorithms produces roughly 1.3 additional ECI points.
1 × 20% × 6.5 = 1.3
Each AI-generated gain is roughly 30% larger than the one before it. In this simplified hypothetical, the feedback loop does more than sustain itself—it accelerates.
Click here to read the paper behind this illustrative trajectory ↗
Click here to read the paper’s calibration and self-sustaining threshold discussion ↗
Obviously, none of these scenarios will play out exactly like this. They provide intuition for the possible trajectories.
The loop does not close
1 × 6.5 × 9.0% = 0.585. One unit of progress feeds back as 0.585 units of new progress.
Loop gain0.585
Loop fadesFadesThreshold = 1Amplifies
A threshold test, not a forecast.
05
Self-sustaining RSI may require 15% per ECI point
So how much are the models currently contributing back to the R&D process which creates them?
We don’t know.
The paper constructs a very rough estimate using Anthropic engineers’ self-reported 4× productivity improvement.
Click here to open Anthropic’s full “When AI Builds Itself” research note ↗
“I started leaning hard into Claudifying about a year ago. That’s been a crazy adventure and it’s now been ~5 months since I last wrote any code myself.”Anthropic Institute ↗
If you spread that 4× uplift across approximately 16 ECI points:
ln(4) ÷ 16 ≈ 9% per ECI point
The reported 4× uplift is probably an overestimate.
15%
Estimated self-sustaining threshold per ECI point.
9.1%
Crude historical estimate per ECI point.
?
Actual current value: unknown.
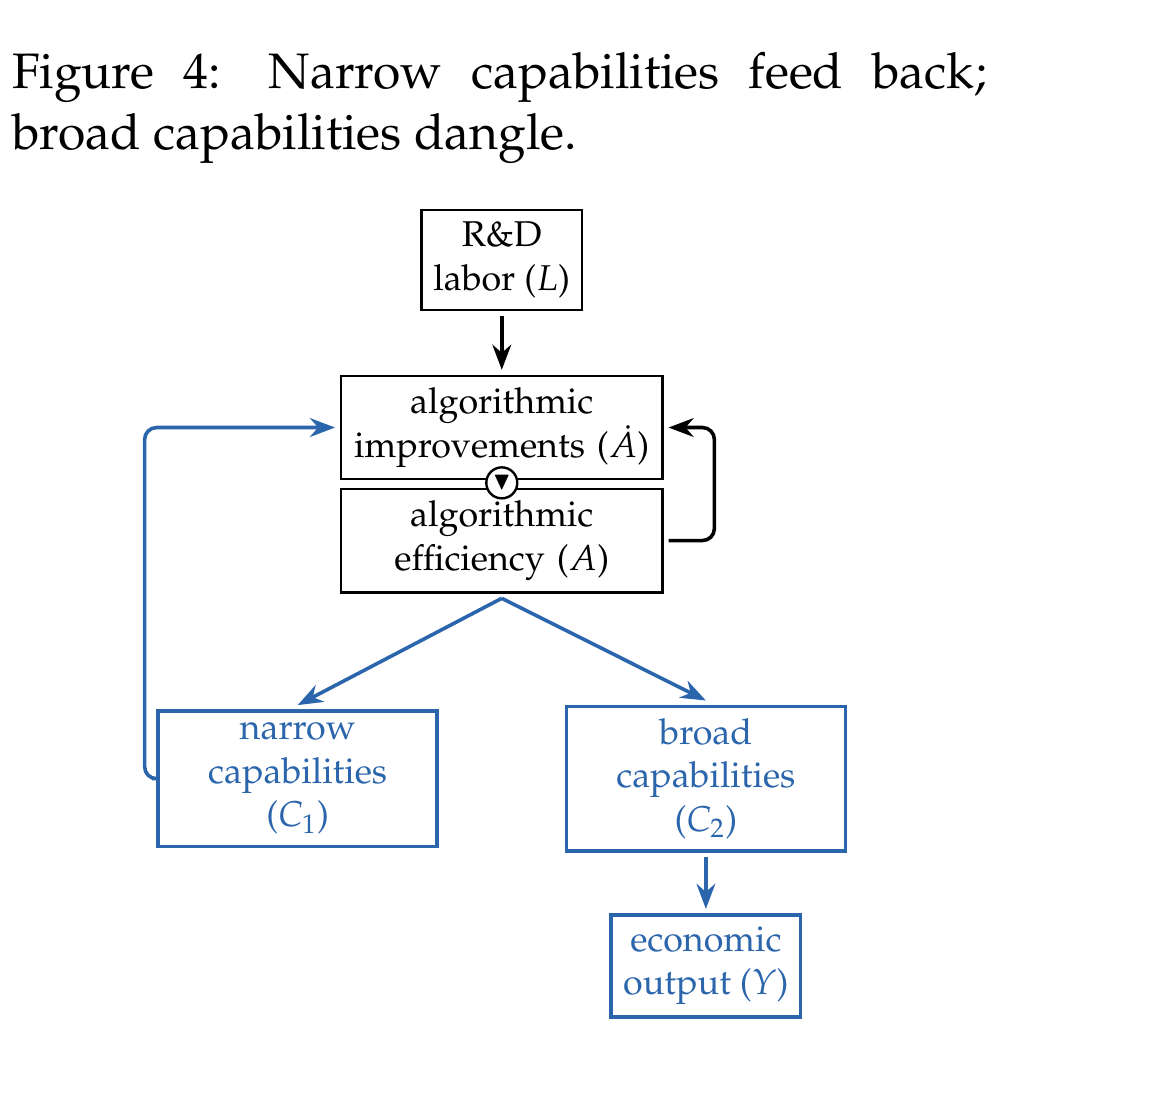
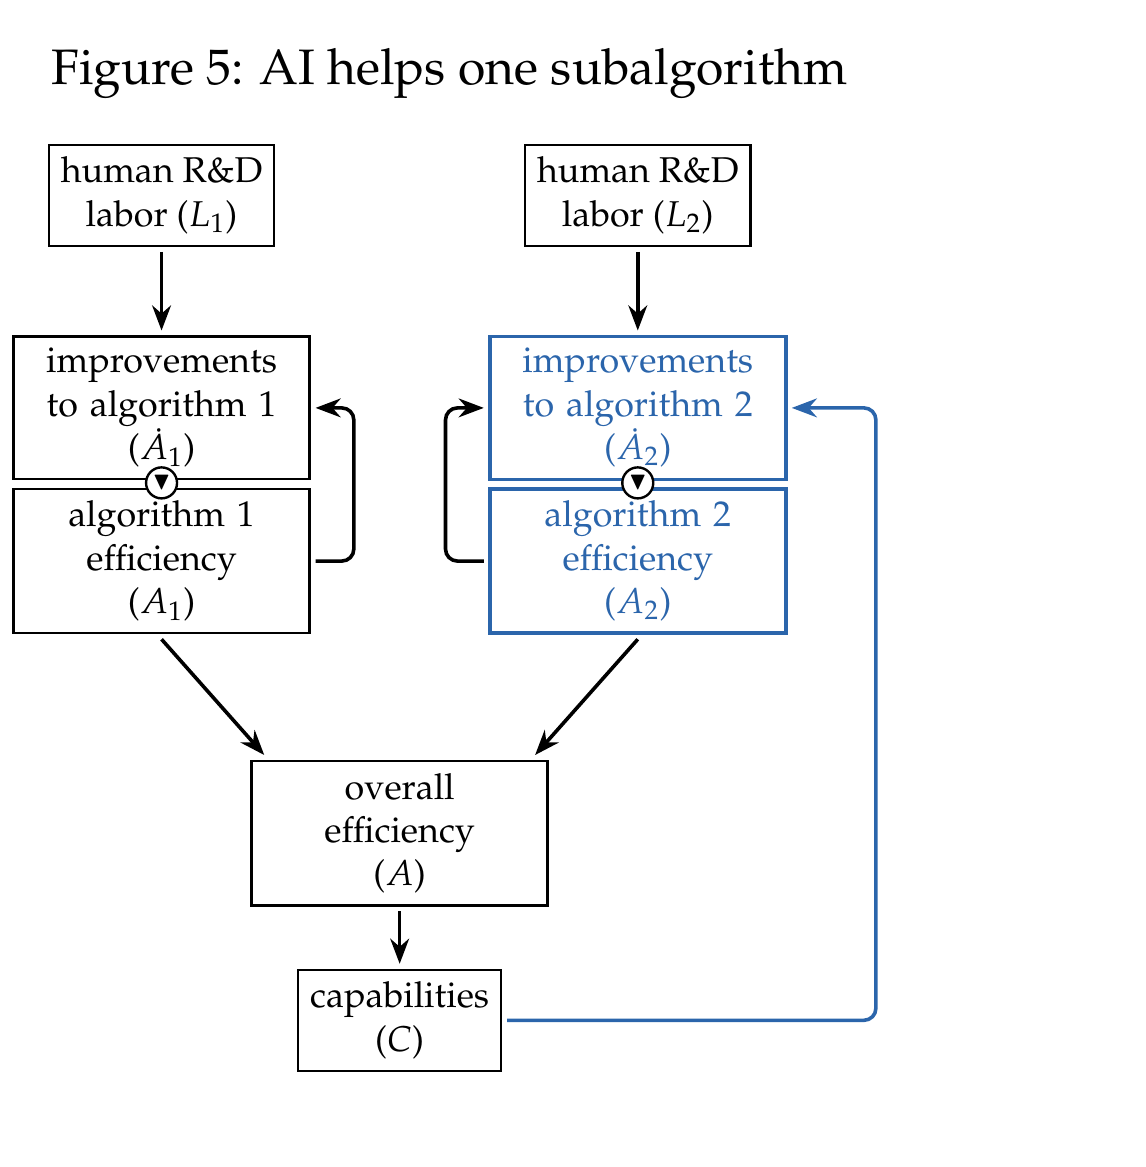
There are many other variables
- What if additional compute lets labs exploit AI-generated research much faster—or compute becomes the bottleneck?
Figure 3 · Open the model with bottlenecks in the paper ↗ - What if humans and AI strongly complement each other—or essential human work becomes the bottleneck?
Figure 3 · Open the model with bottlenecks in the paper ↗ - What if AI becomes exceptionally good at AI research even while remaining weak at other tasks?
Figure 4 · Open the narrow and broad capabilities model ↗ - What if AI rapidly optimises the current bottleneck before progress shifts to a different bottleneck?
Figure 5 · Open the one-subalgorithm model in the paper ↗ - What if better AI generates additional economic resources that can be reinvested in compute, data and research?
Figure 6 · Open the economic feedback model in the paper ↗
If we had better data, we could make better predictions about RSI.
Run the full model
Paradigm’s simulator adds resource allocation, time paths and the paper’s extended models.